To download the Auspice June 2024 Blog as a PDF, click here.

Trend Following managers such as Auspice are widely known for their reliable characteristic of ‘crisis alpha’. Our flagship Auspice Diversified (“ADT”), for example, delivered 44.3% in 2008, 9.7% March 2020, and 17.6% H1 2022. In over 17 years, it has never missed in periods of equity correction.
Additionally, as a commodity tilted manager, harkening back to the origin of CTAs (Commodity Trading Advisors, a US regulatory designation for managers using futures), Auspice can access an expanding basket of global commodities, the most diverse asset class, providing exposure to this opportune and diversifying inflation protecting sector. However, there is more to the profile.
If we naively forgot history, ignored the commodity cycle, and held a strongly bullish equity investment thesis, the same characteristics that produce the defensive attributes of trend following, i.e. crisis alpha, are as equally valuable in a pro risk environment as well [1]. Consider 2020-2023 below in Chart 1. Coincidentally, the MSCI ACWI and ADT produced the exact same annualized return at 8.29% but took different trajectories.
Chart 1 – Growth of $1000; 50/50 Portfolio, Auspice Diversified Trust, MSCI ACWI, 2020-2023
Source: Auspice Capital and Bloomberg. You cannot invest directly in an index
ADT produced its return with a positive skew (more upside volatility) at a lower volatility of 11.8% and drawdown of -15.6% - less than half of equities. As per Table 1 below, regardless of the weighting, the addition of ADT resulted in a combined portfolio with higher absolute and risk-adjusted returns (“Sharpe”) alongside lower drawdown and volatility.
Table 1 – Summary Statistics; Auspice Diversified Trust, MSCI ACWI, 50/50 Portfolio; 2020-2023
| Strategy | Annualized Return | Cumulative Return | Sharpe | Volatility | Max Draw Down | Skew |
|---|---|---|---|---|---|---|
| ADT | 8.29% | 37.46% | 0.73 | 11.78% | -15.59% | 0.30 |
| MSCI ACWI | 8.29% | 37.48% | 0.52 | 18.68% | -33.74% | -0.85 |
| 50/50 Portfolio | 9.32% | 42.80% | 1.00 | 9.61% | -11.91% | -0.58 |
| 60/40 Portfolio | 9.29% | 42.62% | 0.91 | 10.76% | -16.24% | -0.57 |
| 70/30 Portfolio | 9.17% | 41.99% | 0.79 | 12.33% | -20.57% | -0.62 |
| 80/20 Portfolio | 8.96% | 40.93% | 0.69 | 14.21% | -24.89% | -0.71 |
| 90/10 Portfolio | 8.67% | 39.42% | 0.60 | 16.34% | -29.20% | -0.79 |
Source: Auspice Capital and Bloomberg. You cannot invest directly in an index
Over the 4-year period there was a -0.23 correlation to the MSCI ACWI. You would be hard pressed to find a return trajectory more accretive. However, a static correlation metric can fail to capture the whole picture, as demonstrated in Chart 2 below. The -0.23 correlation over 4 years hides the fact that over shorter periods, such as the risk-on period in 2021, ADT can have a positive correlation and enhance portfolio returns during pro-growth periods.
Chart 2 – MSCI ACWI & ADT; 90 Rolling and Static Correlations; 2020-2023
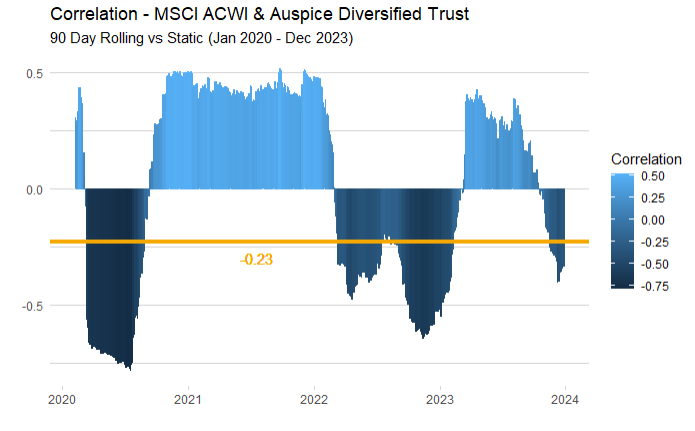
Source: Auspice Capital and Bloomberg. You cannot invest directly in an index
On July 16th, 2020, we can observe a trough correlation of -0.79. In the months prior, Trend Following provided crisis offset and mitigated equity losses. In the following 4 months as equities begin to recover, correlation undergoes a 165% change and is around its peak at 0.51.
What does the chart tell us? That negative correlation to equity markets in periods of correction isn’t the goal of Trend Following CTAs - it’s a symptom. Historically, CTAs provide their most valuable and outsized returns during sustained equity price movements, whether upward or downward. This is shown in what’s known as the CTA smile.
Chart 4 – CTA Smile, Auspice diversified vs MSCI ACWI, (Jan 2007 – May 2024)
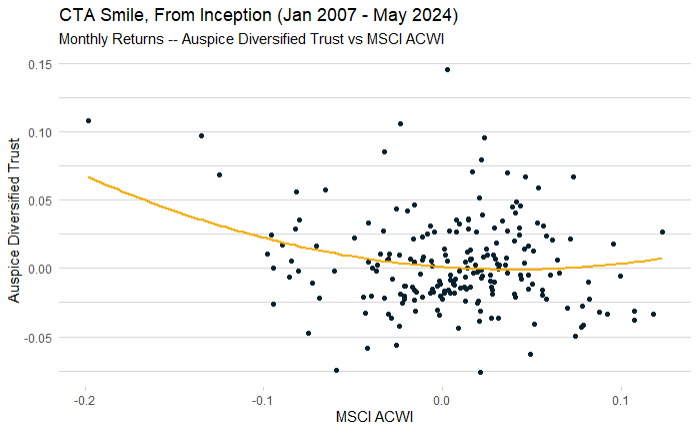
Source: Auspice Capital and Bloomberg. You cannot invest directly in an index
Chart 5 – CTA Smile, BTOP 50 vs MSCI World, (Dec 1986 – May 2024)
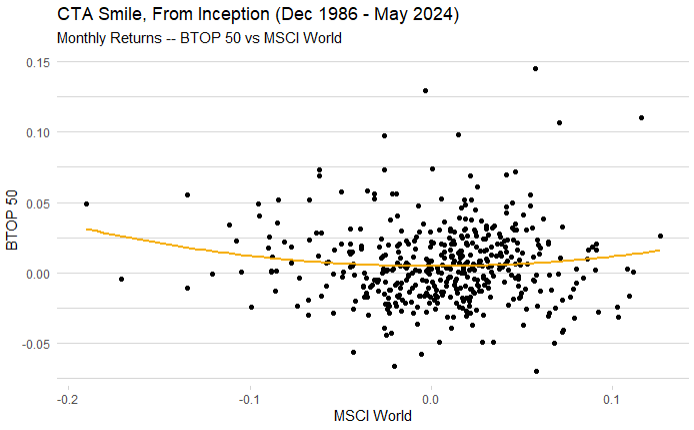
Source: Auspice Capital and Bloomberg. You cannot invest directly in an index
Continuing with the 2020 example – a year with significant volatility both on the downside and upside - in Chart 6 we can see the strategy finding opportunity in a variety of sectors where ADT has exposure. The opportunity of a CTA is broad given exposure in commodity and financial markets broadly but even more vast for Auspice given the greater weighting to a globally diverse commodity portfolio. While different equity and bond positions are similar and highly correlated, commodities are not: to quote Auspice Founder & CIO Tim Pickering, “Cotton is not like Crude is not like Canola is not like Coffee”.
Chart 6 – Sector Risk, Auspice Diversified Trust, (Jan 2020 – Dec 2020)
Source: Auspice Capital
In our view, Trend Following allows investors to hold more equity risk. Trend Following should be approached for its robustness as opposed to its protective attributes. Obviously, the protection provided is a significant consideration, but it doesn’t fully represent their use case [2]. As the post covid landscape drifts more towards historical levels of inflation, volatility, and interest rates, we expect the general perception of Trend Following CTAs will broaden to reflect their robustness as return enhancement opportunities become more frequent.
If you don’t have a 5-10% allocation to tactical commodity or CTAs strategies, contact us today at info@auspicecapital.com
DEFINITIONS
• The MSCI ACWI (Net) Index, is designed to represent performance of the full opportunity set of large- and mid-cap stocks across 23 developed and 26 emerging markets. Price Return data is used (not including dividends), which is not the same basis as the fund's return, which includes distributions. There is a low degree of similarity between the MSCI ACWI and Auspice Diversified Trust. As the main benchmark for global equity performance its inclusion is typically used to illustrate how Auspice Diversified Trust is notably different from global equities, an important consideration for portfolio managers and investors alike.
• The Barclay BTOP50 CTA Index seeks to replicate the overall composition of the managed futures industry with regard to trading style and overall market exposure. The BTOP50 employs a top-down approach in selecting its constituents. The largest investable trading advisor programs, as measured by assets under management, are selected for inclusion in the BTOP50. The index does not encompass the whole universe of CTAs. The CTAs that comprise the index have submitted their information voluntarily and the performance has not been verified by the index publisher.
• The MSCI World Index captures large and mid-cap representation across 23 Developed Markets (DM) countries. With 1,509 constituents, the index covers approximately 85% of the free float-adjusted market capitalization in each country.
IMPORTANT DISCLAIMERS AND NOTES
The returns for Auspice Diversified Trust ("ADT") are “net” (including management and performance fees, interest and expenses). Returns represent the performance for Auspice Managed Futures LP Series 1 (2% mgmt, 20% performance) including and ending November 2019. From this point, returns represent the performance for Auspice Diversified Trust Series X (1% mgmt, 15% performance) which started in July 2014.
Some of the assumptions and opinions contained herein are the view or opinion of the firm and are based on management's analysis of the portfolio performance.
Prior to February 28, 2023, Auspice Diversified Trust was offered via offering memorandum only and this Fund was not a reporting issuer during such prior period. The expenses of the Fund would have been higher during such prior period had the Fund been subject to the additional regulatory requirements applicable to a reporting issuer. Auspice obtained exemptive relief on behalf of the Fund to permit the disclosure of the prior performance data for the Fund for the time period prior to it becoming a reporting issuer.
Commissions, trailing commissions, management fees and expenses may all be associated with investment funds. Please read the prospectus before investing. Investment funds are not guaranteed, their values change frequently and past performance may not be repeated.
The contents on this website are provided for informational and educational purposes and are not intended to provide specific individual advice including, without limitation, investment, financial, legal, accounting and tax. Please consult with your own professional advisor on your particular circumstances.
Futures trading is speculative and is not suitable for all customers. Past results are not necessarily indicative of future results. This document is for information purposes only and should not be construed as an offer, recommendation or solicitation to conclude a transaction and should not be treated as giving investment advice. Auspice Capital Advisors Ltd. makes no representation or warranty relating to any information herein, which is derived from independent sources. No securities regulatory authority has expressed an opinion about the securities offered herein and it is an offence to claim otherwise. Please read the offering documents before investing.
Certain statements in this document are forward- looking statements, including those identified by the expressions “anticipate”, “believe”, “plan”, “estimate”, “expect”, “intend”, “target”, “seek”, “will” and similar expressions to the extent they relate to the Fund and the Manager. Forward- looking statements are not historical facts but reflect the current expectations of the Fund and the Manager regarding future results or events. Such forward-looking statements reflect the Fund’s and the Manager’s current beliefs and are based on information currently available to them. Forward-looking statements are made with assumptions and involve significant risks and uncertainties. Although the forward-looking statements contained in this document are based upon assumptions that the Fund and the Manager believe to be reasonable, neither the Fund or the Manager can assure investors that actual results will be consistent with these forward-looking statements. As a result, readers are cautioned not to place undue reliance on these statements as a number of factors could cause actual results or events to differ materially from current expectations.
The forward-looking statements contained herein were prepared for the purpose of providing prospective investors with general educational background information about the Funds and may not be appropriate for other purposes. Neither the Fund or the Manager assumes any obligation to update or revise them to reflect new events or circumstances, except as required by law.
This blog may contain hypertext links to web sites owned and controlled by other parties than Auspice. We have no control over any third-party-owned web sites or content referred to, accessed by or available on this web site and therefore we do not endorse, sponsor, recommend or otherwise accept any responsibility for such third-party web sites or content or for the availability of such web sites. In particular, we do not accept any liability arising out of any allegation that any third-party-owned content (whether published on this or any other web site) infringes the intellectual property rights of any person, or any liability arising out of any information or opinion contained on such third-party web site or content
[1] - https://open.spotify.com/episode/3mKAX4d1YVMwQd5SU4ITum?si=5f45d6b91e5044b1
[2] - https://www.cfm.com/wp-content/uploads/2022/12/266-2018-The-Convexity-of-trend-following.pdf