
To download the Auspice August 2024 Blog as a PDF, click here.
Like a kicker in football, Auspice Diversified is a Special Teams player that all portfolios should have. The role is important - it helps win games and in our case, protects portfolios.
As the US market opened on August 5th the flagship Auspice Diversified was up just over 2.5% for the day and month, delivering accretive crisis alpha as it has done so reliably for 18 years. How does this happen? What can you expect from Auspice Diversified and how does it compare to other CTAs during equity selloffs?
This month we look at the equity selloff at the beginning of August as a case study to help investors understand how we trade and our “Crisis Alpha” profile. August 1st to August 5th equities experienced a quick, severe selloff, with the VIX experiencing its largest ever intraday jump ever on August 5th (see Chart 1 below) following a significant breakout on Friday August 2nd.
Chart 1 – Record Intraday Volatility Expansion on August 5th, 2024.

The move in the VIX provides a glimpse into how we trade - and importantly protect - investor capital. Coming into July, Auspice Diversified was short the VIX as it had been trending down. At the end of the month the position was covered as volatility increased, and we further took a long position on August 2nd. This position was then exited overnight after the August 5th move higher, capturing the gains before a significant retreat – see below.
Chart 2 – Auspice Diversified’s Nimble Approach to Trend Following Profited from Moves in the VIX.

Source: Auspice Capital
The agility of our strategies, amongst other factors discussed later on, is a key differentiating factor in our Crisis Alpha profile. Had the selloff continued, Auspice Diversified was well positioned to deliver Crisis Alpha as it has done reliably for 18 years, and more so versus its CTA peers. As per Chart 3 below, despite giving back gains as markets reversed Monday (Auspice Diversified finished +1% and Nasdaq recovered 2%), Auspice Diversified finished the selloff period positive, whereas the CTA benchmarks and the five largest managed futures ETFs[1] trailed, some down significantly.
Chart 3 – CTA and Equity Performance, August 1st to 5th 2024.
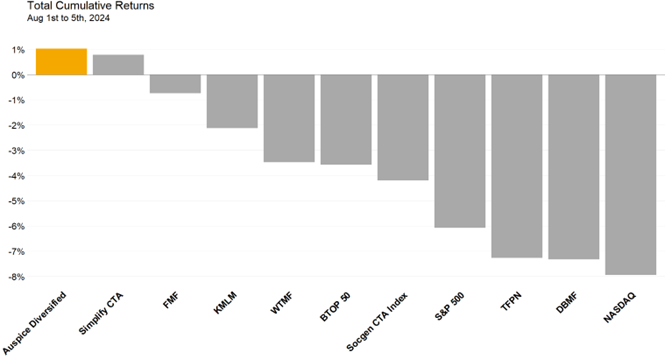
Source: Auspice Capital and Bloomberg. You cannot invest directly in an index.
Why More Crisis Alpha Versus CTA / Managed Futures Peers?
Auspice Diversified’s Crisis Alpha outperformance can largely be attributed to three factors:
Commodity focus, and exclusion of many financial markets other CTAs trade.
Medium term, agile trend following approach.
Trend “capturing” risk management captures and crystallizes gains.
Auspice Diversified is much more commodity focused than most CTA / Managed Futures peers. Our average 75% risk allocation to commodities is the opposite of many peers, typically with 20-30% risk allocations to commodities, with the large majority in equity indices, bond, and currency futures.
The combination of not having nearly as much equity exposure, and also being more nimble, allows us to avoid the losses peers may face in the earlier part of an equity selloff, as occurred in early August. Our approach to trend following – what we have long described as “trend capture” – also tends to be more agile. With an average holding period of 65 days and a number of risk management techniques, we are more reactive than most peers, particularly some of the ETFs, trading just once a day or even once a week.
Last, and important, in “risk-off” equity corrections and recessions, commodity dislocations tend to be much larger and accordingly provide the greatest Crisis Alpha opportunities. Consider oil in 2008 or more recently during COVID. WTI Crude Oil was trading around $50 at the end of February 2020, traded down towards $20 in March, and then negative in April (see Chart 4 below, this led to a nearly 10% gain for the portfolio). A similar large dislocation took place during the Global Financial Crisis with oil trading from $150 to $40. These are great opportunities for agile trend-capturing approaches such as those employed by Auspice.
Chart 4 – Auspice Diversified’s Agile, Commodity Focused Trend Capture Led to Outperformance (+9.7%) Versus the BTOP50 CTA Benchmark, -1.2%, in March 2020.

Source: Auspice Capital and Bloomberg. You cannot invest directly in an index.
It is important to note here that this approach leads to highly reliable crisis alpha capture, but not 100% guarantee. Auspice Diversified has a slight negative correlation to equity indices and CTA peers, but it is not -1.0. It is best to think of us as essentially independent from equities (intuitive, given our little equity exposure) and a zero correlation to equities. However, given both commodity and financial market opportunities tend to be greater for trend following during an equity crisis period, this pushes us to a slight negative equity correlation (see “CTA Smile”, Chart 4 in the Auspice June Blog).
This Crisis Alpha outperformance comes with a caveat – agility and nimbleness, while very accretive as was the case in early August, can be a double-sided sword. In periods of volatility without sustained price movement, Auspice Diversified can be more chopped up versus peers. Indeed, recently Auspice Broad Commodity (underlying of the NYSE “COM” and TSX “CCOM” ETFs) has outperformed given its longer-term approach and lesser reactiveness. And versus CTA peers, after 3 years of significant outperformance 2020-2022, Auspice Diversified has trailed some of our longer term, financially focused peers recently.
Looking Forward.
At a high-level Auspice Diversified has two core objectives – Crisis Alpha, and Commodity Alpha (outperformance). As per performance at the beginning of August, we were positioned to deliver strong returns had the selloff continued, and we delivered notable outperformance over that brief period.
In terms of commodity alpha and upside, could now be the opportune time?
As discussed in our Outlook last month:
“In three of five prior commodity bull markets, corresponding approximately with the 1970s, 1980s, and 2000s, the Goldman Sachs Commodity Benchmark ("GSCI TR") delivered strong double digit
annualized performance. Each commodity bull market experienced one or two multiyear corrections prior to making new all-time highs. There were a total of four bull market corrections, with a maximum duration of 32 months (1970s), and average duration of 20 months. It has now been 26 months since the May 2022 commodity highs.”
We have no crystal ball, but we believe we may be on the cusp of significant volatility and commodity upside.
If you don’t have a 5-10% allocation to tactical commodity or CTAs strategies, contact us today at info@auspicecapital.com.
IMPORTANT DISCLAIMERS AND NOTES
The returns for Auspice Diversified Trust ("ADT") are “net” (including management and performance fees, interest and expenses). Returns represent the performance for Auspice Managed Futures LP Series 1 (2% mgmt, 20% performance) including and ending November 2019. From this point, returns represent the performance for Auspice Diversified Trust Series X (1% mgmt, 15% performance) which started in July 2014.
The indicated rates of return are the historical annual compounded total returns including changes in share and/or unit value and reinvestment of all dividends and/or distributions and do not take into account sales, redemption, distribution or optional charges or income taxes payable by any securityholder that would have reduced returns.
Some of the assumptions and opinions contained herein are the view or opinion of the firm and are based on management's analysis of the portfolio performance.
Prior to February 28, 2023, Auspice Diversified Trust was offered via offering memorandum only and this Fund was not a reporting issuer during such prior period. The expenses of the Fund would have been higher during such prior period had the Fund been subject to the additional regulatory requirements applicable to a reporting issuer. Auspice obtained exemptive relief on behalf of the Fund to permit the disclosure of the prior performance data for the Fund for the time period prior to it becoming a reporting issuer.
Commissions, trailing commissions, management fees and expenses may all be associated with investment funds. Please read the prospectus before investing. Investment funds are not guaranteed, their values change frequently and past performance may not be repeated.
The contents on this website are provided for informational and educational purposes and are not intended to provide specific individual advice including, without limitation, investment, financial, legal, accounting and tax. Please consult with your own professional advisor on your particular circumstances.
Futures trading is speculative and is not suitable for all customers. Past results are not necessarily indicative of future results. This document is for information purposes only and should not be construed as an offer, recommendation or solicitation to conclude a transaction and should not be treated as giving investment advice. Auspice Capital Advisors Ltd. makes no representation or warranty relating to any information herein, which is derived from independent sources. No securities regulatory authority has expressed an opinion about the securities offered herein and it is an offence to claim otherwise. Please read the offering documents before investing.
Certain statements in this document are forward- looking statements, including those identified by the expressions “anticipate”, “believe”, “plan”, “estimate”, “expect”, “intend”, “target”, “seek”, “will” and similar expressions to the extent they relate to the Fund and the Manager. Forward- looking statements are not historical facts but reflect the current expectations of the Fund and the Manager regarding future results or events. Such forward-looking statements reflect the Fund’s and the Manager’s current beliefs and are based on information currently available to them. Forward-looking statements are made with assumptions and involve significant risks and uncertainties. Although the forward-looking statements contained in this document are based upon assumptions that the Fund and the Manager believe to be reasonable, neither the Fund or the Manager can assure investors that actual results will be consistent with these forward-looking statements. As a result, readers are cautioned not to place undue reliance on these statements as a number of factors could cause actual results or events to differ materially from current expectations.
The forward-looking statements contained herein were prepared for the purpose of providing prospective investors with general educational background information about the Funds and may not be appropriate for other purposes. Neither the Fund or the Manager assumes any obligation to update or revise them to reflect new events or circumstances, except as required by law.
This blog may contain hypertext links to web sites owned and controlled by other parties than Auspice. We have no control over any third-party-owned web sites or content referred to, accessed by or available on this web site and therefore we do not endorse, sponsor, recommend or otherwise accept any responsibility for such third-party web sites or content or for the availability of such web sites. In particular, we do not accept any liability arising out of any allegation that any third-party-owned content (whether published on this or any other web site) infringes the intellectual property rights of any person, or any liability arising out of any information or opinion contained on such third-party web site or content.
[1] https://etfdb.com/etfs/alternatives/managed-futures/
DEFINITIONS
• The MSCI ACWI (Net) Index, is designed to represent performance of the full opportunity set of large- and mid-cap stocks across 23 developed and 26 emerging markets. Price Return data is used (not including dividends), which is not the same basis as the fund's return, which includes distributions. There is a low degree of similarity between the MSCI ACWI and Auspice Diversified Trust. As the main benchmark for global equity performance its inclusion is typically used to illustrate how Auspice Diversified Trust is notably different from global equities, an important consideration for portfolio managers and investors alike.
• The Barclay BTOP50 CTA Index seeks to replicate the overall composition of the managed futures industry with regard to trading style and overall market exposure. The BTOP50 employs a top-down approach in selecting its constituents. The largest investable trading advisor programs, as measured by assets under management, are selected for inclusion in the BTOP50. The index does not encompass the whole universe of CTAs. The CTAs that comprise the index have submitted their information voluntarily and the performance has not been verified by the index publisher.
• The Nasdaq Composite is a stock market index that includes almost all stocks listed on the Nasdaq stock exchange. Along with the Dow Jones Industrial Average and S&P 500, it is one of the three most-followed stock market indices in the United States.
• The SG CTA Index provides the market with a reliable daily performance benchmark of major commodity trading advisors (CTAs). The SG CTA Index calculates the daily rate of return for a pool of CTAs selected from the larger managers that are open to new investment. Selection of the pool of qualified CTAs used in construction of the Index will be conducted annually, with re-balancing on January 1st of each year.
• The Standard and Poor's 500, or simply the S&P 500, is a stock market index tracking the stock performance of 500 of the largest companies listed on stock exchanges in the United States.