To download the Auspice November 2024 Blog as a PDF, click here.
“It is even harder to time those that themselves are market-timers.”[1]
“The possibility of making money increases dramatically if the investor maintains the allocation to managed futures three to five years.”[2]
Auspice Diversified kicked off the 2020s with strong outperformance versus CTA benchmarks. Our commodity tilted approach led to better crisis and commodity alpha, and performance in times of equity weakness and inflation. Unlike larger, typically financially focused CTA peers, Auspice captured the Q1 2020 selloff, and then pivoted to capture the ensuing rally (commodity and financial) in H2 2020. Outperformance continued into the summer of 2022 when commodities began to consolidate, and equities started to rebound. The net result two years later - essentially the same as the CTA benchmarks, with periods of valuable outperformance. Per Chart 1 below, Auspice Diversified remains slightly ahead of the SG CTA index, and ever slightly below the BTOP50 CTA index after a long period of outperformance.
Chart 1: Auspice Diversified versus the BTOP50 CTA and SG CTA Benchmark Indexes since 2020.
Source: Auspice Capital and Bloomberg. You can not invest in an index.
What explains this?
There are a number of factors to consider, including risk management, agility and time horizon. However, at a high level the biggest factor is portfolio construction in that on average, Auspice has 75% risk in commodities, with a 25% financial risk split between equity, fixed income, and currency risk. Our CTA peers, particularly large US and European CTA peers, tend to be the opposite, with just 25% risk in commodities - mostly due to trading constraints and capacity - and 75% risk in financial markets.
Importantly, since H2 2022, while there has been the odd commodity market that has had momentum and trends, such as coffee and until recently gold, the majority of commodities have continued to consolidate post a strong period 2020 to H1 2022. This can be illustrated by the commodity benchmarks, BCOM ER and GSCI ER, both down on a rolling 1 year basis and correcting 26.7% and 23.4% respectively since peaking in May 2022. Financials on the other hand, equities particular, have rallied since and provided strong trend following returns.
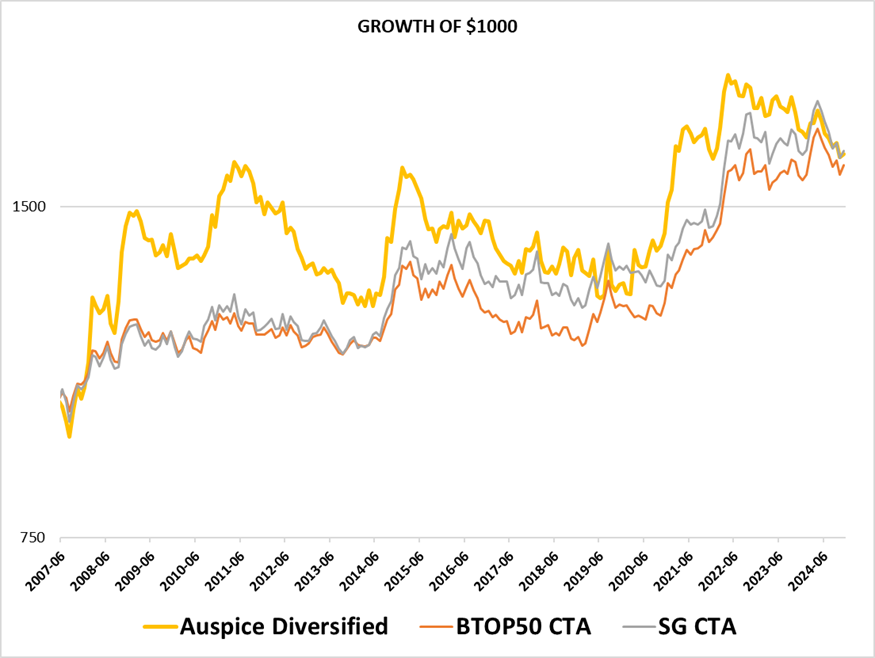
How should this be considered on a long-term basis? For almost all of our history, Auspice Diversified has outperformed the CTA benchmarks. This occurred especially at critical times including 2008, 2010, 2014, 2020 and in H1 2022. See Charts 2 and 3 below.
Chart 2: Auspice Diversified versus the BTOP50 CTA and SG CTA benchmarks since 2007.
Source: Auspice Capital and Bloomberg. You can not invest in an index.
Chart 3: Auspice Diversified versus the BTOP50 CTA and equity indices at critical times.
Source: Auspice Capital and Bloomberg. You can not invest in an index.
Our commodity focus, and more nimble, agile trading has delivered stronger results with more diversification (slight negative equity correlation, versus slight positive equity correlation).
Performance Chasing
While CTAs have always been a popular area for institutional investors, with many of the largest public pensions having 5-10% portfolio allocations[1], the relative performance in 2020 and 2022 led to retail mutual fund investors climbing aboard while equities and bonds were falling. During the first nine months of 2022, the relative performance gap between the managed futures / CTA category average and the S&P 500 was 43%. This coincided with the category taking in $8.5 billion in the first 10 months of the year, bringing total mutual fund assets up to just shy of $25 billion, doubling in 18 months[2] (institutional commingled CTA funds climbed to $365 billion from $347 billion in 2021[3]).
In effect, for retail investors this meant selling equities after they had fallen and buying CTAs after a period of strong performance. The Morningstar article “Market Wizards Wave Their Wands but Investors Miss the Magic” described this in detail, comparing “Total Returns” versus “Investor Returns”.
“The Morningstar Investor Return data point in Morningstar Direct uses a dollar-weighted return to measure how the average investor fared in a fund over a period. This considers the impact of cash inflows and outflows from purchases and sales and the growth in fund assets.”
Consider the “gap” between Total Returns, and Investor Returns, in two of the largest CTA / Managed Futures fund managers (AQR and PIMCO) on a 3-year annualized basis in Table 1.
Table 1 – Investor Returns of Systematic Trend Managers.
Source: https://www.morningstar.com/funds/market-wizards-wave-their-wands-investors-miss-magic
What to do - Looking forward
We don’t make money every month, quarter or year - we make money when it counts and have never missed. Even in years like 2024, at times when equity corrected, Auspice Diversified delivered (see Chart 4 below). The value has been demonstrated time and time again, and today amidst a CTA drawdown, Auspice is essentially on sale (see Auspice October Blog for more).
Chart 4: Auspice Diversified versus the BTOP50 CTA and Equity Indices, 2024.
Source: Auspice Capital and Bloomberg. You can not invest in an index.
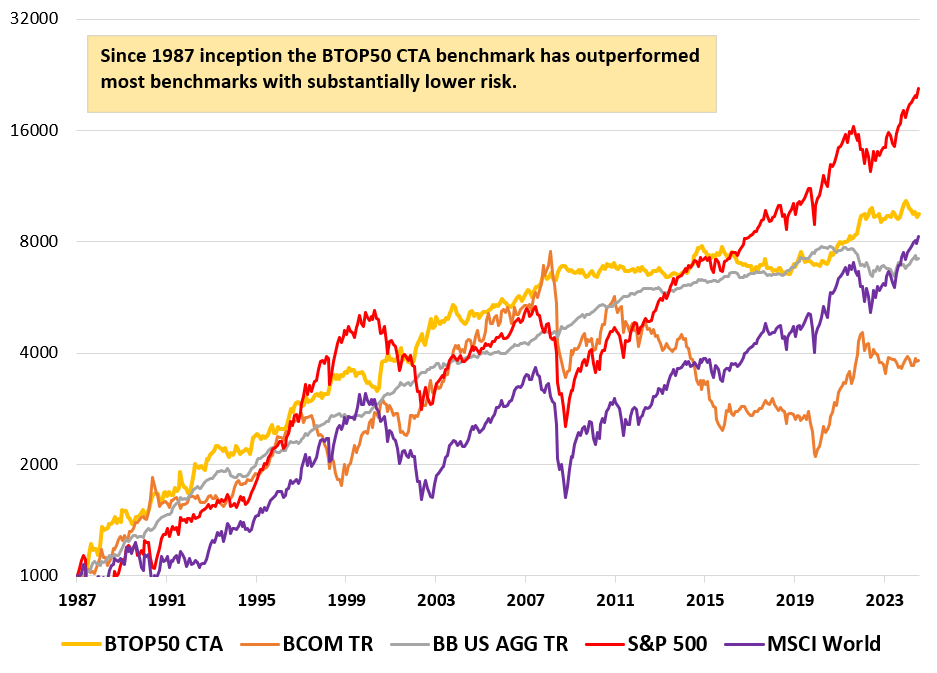
For a final thought, consider the BTOP50 CTA benchmark versus the globally diversified MSCI World equity benchmark, the diversified BCOM TR Commodity benchmark, and the Barclay’s Agg Bond Benchmark. We have also included the top performing S&P500 equity benchmark.
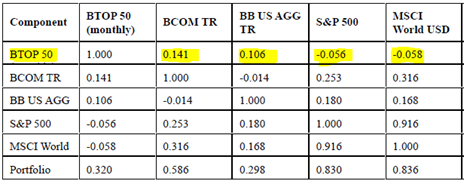
Consider performance alongside risk (particularly max drawdown) metrics and diversification (correlation and skew) benefits in Chart 5 alongside Tables 2 & 3.
Chart 5 – BTOP50 CTA vs MSCI ACWI, BCOM TR, Barclays Agg, & SP500 since BTOP50 Inception (1987).
Source: Auspice Capital and Bloomberg. You can not invest in an index.
Table 2 Performance - BTOP50 CTA, BCOM TR, Barclays Agg “BB US), SP500, & MSCI World since BTOP50 Inception (1987).
Source: Auspice Capital and Bloomberg. You can not invest in an index.
Table 3 Correlation - BTOP50 CTA, BCOM TR, Barclays Agg “BB US), SP500, & MSCI World since BTOP50 Inception (1987).
Source: Auspice Capital and Bloomberg. You can not invest in an index.
As you can see in Chart 5, like Auspice Diversified, the BTOP50 CTA benchmark doesn’t deliver every day, month or year – indeed there was a lost decade 2011-2019 (not unlike those experienced with equities 1999-2009, and bonds more recently) when CTAs did not deliver (nor did they detract much).
Outside of the S&P500 – increasingly a concentrated bet on US Tech – the top performing diversified benchmark, particularly when considering portfolio metrics, is the BTOP50 CTA index. It is above all other benchmark for a majority of its existence, and if history is any guide, it could very well return to its leadership position. Consider it also has the lowest Max Drawdown (Table 2), and a near zero correlation (Table 3) to every other asset class benchmark.
If you don’t have a 5-10% allocation to CTAs strategies, or are not at your target weight, now may be an opportune time to rebalance out of recent equity strength and into CTAs.
PUBLICATION DATE: December 2nd 2024.
DEFINITIONS
· The S&P Goldman Sachs Commodity Total Return Index (“GSCI TR”) is a composite index of commodity sector returns representing an unleveraged, long-only investment in commodity futures that is broadly diversified across the spectrum of commodities. The S&P GSCI Total Return index measures a fully collateralized commodity futures investment that is rolled forward from the fifth to the ninth business day of each month.
· The Barclay BTOP50 CTA Index seeks to replicate the overall composition of the managed futures industry with regard to trading style and overall market exposure. The BTOP50 employs a top-down approach in selecting its constituents. The largest investable trading advisor programs, as measured by assets under management, are selected for inclusion in the BTOP50. The index does not encompass the whole universe of CTAs. The CTAs that comprise the index have submitted their information voluntarily and the performance has not been verified by the index publisher.
· The SG CTA Index provides the market with a reliable daily performance benchmark of major commodity trading advisors (CTAs). The SG CTA Index calculates the daily rate of return for a pool of CTAs selected from the larger managers that are open to new investment. Selection of the pool of qualified CTAs used in construction of the Index will be conducted annually, with re-balancing on January 1st of each year.
· The Standard and Poor's 500, or simply the S&P 500, is a stock market index tracking the stock performance of 500 of the largest companies listed on stock exchanges in the United States.
· The MSCI World Index captures large and mid-cap representation across 23 Developed Markets (DM) countries. With 1,509 constituents, the index covers approximately 85% of the free float-adjusted market capitalization in each country.
· The Bloomberg Commodity Index Excess Return (BCOM TR) Index is a broadly diversified commodity price index that tracks prices of futures contracts on physical commodities on the commodity markets. No one commodity can compose more than 15% of the BCOM ER index, no one commodity and its derived commodities can compose more than 25% of the index, and no sector can represent more than 33% of the index.
· The S&P/ TSX 60 Index is designed to represent leading companies in leading industries. Its 60 stocks make it ideal for coverage of companies with lar ge market capitalizations and a cost efficient way to achieve Canadian equity exposure. Price Return data is used (not including dividends).
IMPORTANT DISCLAIMERS AND NOTES
The returns for Auspice Diversified Trust ("ADT") are “net” (including management and performance fees, interest and expenses). Returns represent the performance for Auspice Managed Futures LP Series 1 (2% mgmt, 20% performance) including and ending November 2019. From this point, returns represent the performance for Auspice Diversified Trust Series X (1% mgmt, 15% performance) which started in July 2014.
The indicated rates of return are the historical annual compounded total returns including changes in share and/or unit value and reinvestment of all dividends and/or distributions and do not take into account sales, redemption, distribution or optional charges or income taxes payable by any securityholder that would have reduced returns.
Some of the assumptions and opinions contained herein are the view or opinion of the firm and are based on management's analysis of the portfolio performance.
Prior to February 28, 2023, Auspice Diversified Trust was offered via offering memorandum only and this Fund was not a reporting issuer during such prior period. The expenses of the Fund would have been higher during such prior period had the Fund been subject to the additional regulatory requirements applicable to a reporting issuer. Auspice obtained exemptive relief on behalf of the Fund to permit the disclosure of the prior performance data for the Fund for the time period prior to it becoming a reporting issuer.
Commissions, trailing commissions, management fees and expenses may all be associated with investment funds. Please read the prospectus before investing. Investment funds are not guaranteed, their values change frequently and past performance may not be repeated.
The contents on this website are provided for informational and educational purposes and are not intended to provide specific individual advice including, without limitation, investment, financial, legal, accounting and tax. Please consult with your own professional advisor on your particular circumstances.
Futures trading is speculative and is not suitable for all customers. Past results are not necessarily indicative of future results. This document is for information purposes only and should not be construed as an offer, recommendation or solicitation to conclude a transaction and should not be treated as giving investment advice. Auspice Capital Advisors Ltd. makes no representation or warranty relating to any information herein, which is derived from independent sources. No securities regulatory authority has expressed an opinion about the securities offered herein and it is an offence to claim otherwise. Please read the offering documents before investing.
Certain statements in this document are forward- looking statements, including those identified by the expressions “anticipate”, “believe”, “plan”, “estimate”, “expect”, “intend”, “target”, “seek”, “will” and similar expressions to the extent they relate to the Fund and the Manager. Forward- looking statements are not historical facts but reflect the current expectations of the Fund and the Manager regarding future results or events. Such forward-looking statements reflect the Fund’s and the Manager’s current beliefs and are based on information currently available to them. Forward-looking statements are made with assumptions and involve significant risks and uncertainties. Although the forward-looking statements contained in this document are based upon assumptions that the Fund and the Manager believe to be reasonable, neither the Fund or the Manager can assure investors that actual results will be consistent with these forward-looking statements. As a result, readers are cautioned not to place undue reliance on these statements as a number of factors could cause actual results or events to differ materially from current expectations.
The forward-looking statements contained herein were prepared for the purpose of providing prospective investors with general educational background information about the Funds and may not be appropriate for other purposes. Neither the Fund or the Manager assumes any obligation to update or revise them to reflect new events or circumstances, except as required by law.
This blog may contain hypertext links to web sites owned and controlled by other parties than Auspice. We have no control over any third-party-owned web sites or content referred to, accessed by or available on this web site and therefore we do not endorse, sponsor, recommend or otherwise accept any responsibility for such third-party web sites or content or for the availability of such web sites. In particular, we do not accept any liability arising out of any allegation that any third-party-owned content (whether published on this or any other web site) infringes the intellectual property rights of any person, or any liability arising out of any information or opinion contained on such third-party web site or content.
[1]https://static1.squarespace.com/static/53a1ca9ce4b030ded763dbc2/t/61893c333a527d3e6536ffa2/1636383796359/Commodities+%26+CTAs+Case+Study%2C+US+Pensions+%26+Ontario+Teachers%27+-+Auspice.pdf
[2] https://www.morningstar.com/funds/market-wizards-wave-their-wands-investors-miss-magic
[3] https://www.barclayhedge.com/solutions/assets-under-management/cta-assets-under-management/CTA-industry/


